Sars-Cov-2 is on a 120 day global wave cycle. It may not be a natural entity.
Decoding Sars-Cov-2: The Sars-Cov-2 virus features a global timer, set parameters, sub-routines, coded warning flags and probably has a built-in expiry date. It is predictable, and it may also be hackable. It may not be a natural entity.
Sars-Cov-2 looks more like a computer virus every time we look at it. Is it a natural entity, or has it been manufactured? Are these waves coincidental, or are they under the control of someone or something?
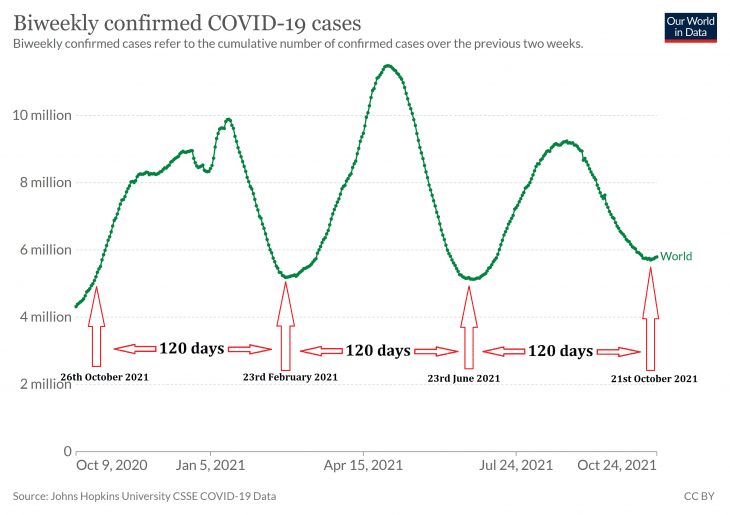
Firstly, let’s take a look at the timing of those global Covid waves again.
Does this look natural to you in any way?
We are going to be looking in detail at the extraordinary coding of this virus in another post, including the global timing you can see above, the set parameters, repeating sub-routines and warning flags, but below are a few examples that we have already covered in previous posts.
Global Timer & Repeating Routines: We predicted on the 11th October 2021 that the next global Covid wave trough would be between 19th October and 23rd October 2021, based on our observation of the global timer and the repeating sub-routines. The trough was actually on the 20th October 2021. See below
Evidence of two global Covid waves in 2020, and estimating the pandemic start date
Global Timer: On the 3rd October 2021, we showed that global Covid waves were timed roughly 4 months apart. Our prediction of a trough on the 23rd October was out by 3 days because the waves are 120 days apart and not 4 months as we previously suspected. You can also see a baseline forming in the chart, a minimum and maximum number of Covid cases using clearly set parameters:
Evidence of two global Covid waves in 2020, and estimating the pandemic start date
Repeating Patterns & Warning Flags: We predicted on 9th June 2021 that the UK would see a summer Covid wave based on a repeating pattern in the code, a red warning flag. The wave did occur, Covid case numbers increased until 23rd July 2021. The UK graph for the summer of 2021 is shown in the post. We see these warning flags in the code quite often.
Evidence of two global Covid waves in 2020, and estimating the pandemic start date
Set Parameters: We noted how Sars-Cov-2 has set parameters in a post on 27th April 2021. The parameters still seem to hold true:
Evidence of two global Covid waves in 2020, and estimating the pandemic start date
So, from a coding point of view, is this a masterpiece, or the work of an amateur?
Actually, the quality of the coding reminds us of this 1970’s Atari game:
A higher level of sophistication is required to create the consistent global wave patterns seen in the charts above from the smaller, less obviously timed continental and national waves, but a decent supercomputer could probably crack it in, say, 5 minutes?
Finally, if this IS an unnatural process, we fully expect these patterns to change quite quickly…
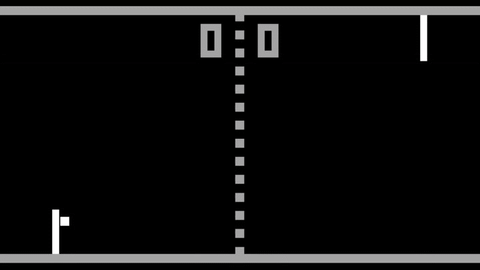
Below is our recreation of the first global winter wave of 2020/2021, a wave that was broken in half by national lockdowns and other mitigations that were introduced in early November 2020.
More in our Decoding Sars-Cov-2 series:
-
- How bad will the winter wave of 2021 – 2022 be?
- How are global Covid waves formed, and can we predict future waves?
- The extraordinary coding behind Sars-Cov-2
- Does anything else in nature have a 120 day cycle?
- Is Sars-Cov-2 natural or man-made?
- What does the 120 day Covid cycle mean for you?
- Is Sars-Cov-2 hackable?
- Predicting Sars-Cov-2 waves using repeating code snippets
- Sars-Cov-2 is on a 120 day global wave cycle. It may not be a natural entity (this post)
- Evidence of two global Covid waves in 2020, and estimating the pandemic start date
- Sars-COV-2 – a virus that oscillates between killing 5,000 to 20,000 a day for an entire year?
- How bad will the winter wave of 2021 – 2022 be?
Here’s the interactive chart that you can update with your refresh button:
Evidence of two global Covid waves in 2020, and estimating the pandemic start date