Evidence of two global Covid waves in 2020, and estimating the pandemic start date
Global Covid waves have been easy to spot in 2021 with their distinctive sine wave pattern, but what about 2020, when testing was largely limited to those with symptoms until late into that year?
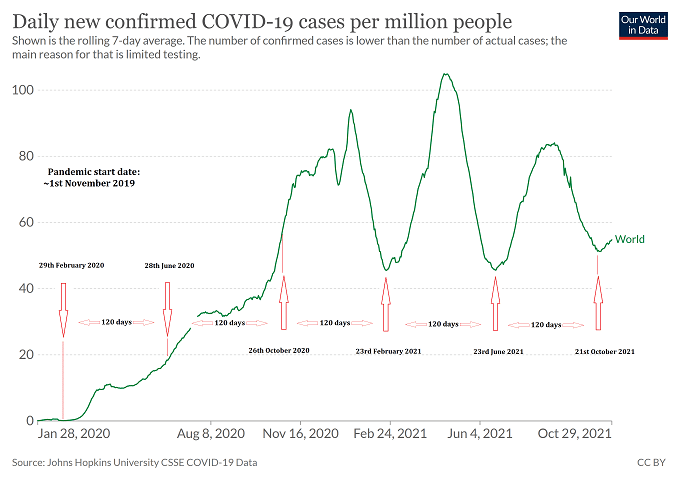
There seems to be evidence of two previous global waves of Sars-Cov-2 in 2020, and it may be possible to estimate a start date for the pandemic by simply rolling the 120 day global cases wave rate back to 2019.
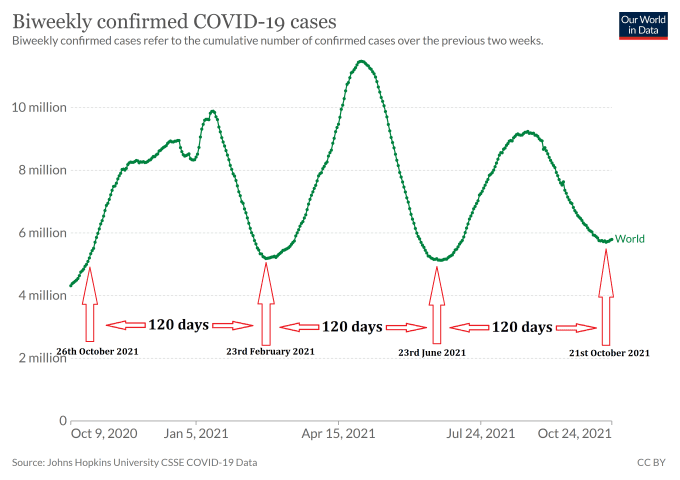
Firstly, let’s take another look at the evidence of a regular global Covid wave rate in 2021. It’s about 120 days between the trough of each wave:
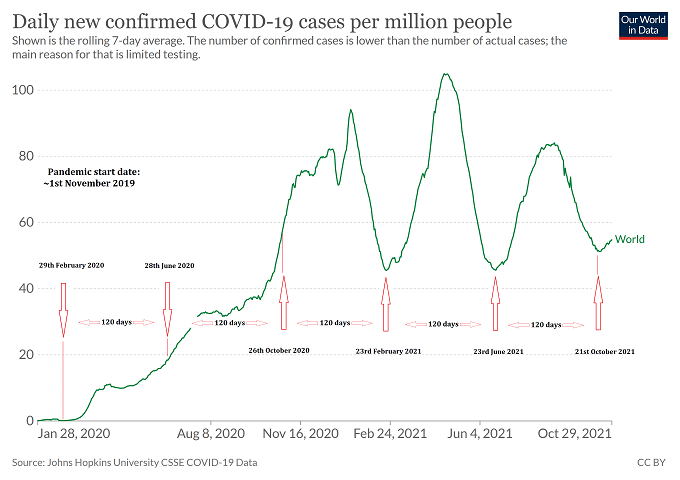
In our updated global cases wave chart below, you can see faint signs that the global wave pattern for Covid cases extended right through 2020, and possibly as far back as the start of the pandemic in 2019. There are now five waves showing, and a sixth global wave has just started.
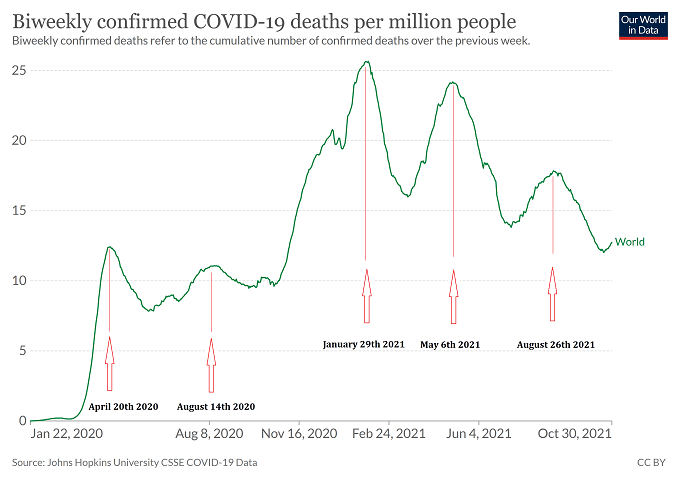
The global deaths chart below shows clearer evidence of 5 global waves so far, with the sixth wave starting in October 2021. Note that the timing of the wave *peaks* for deaths or cases is far less important than the timing of the global *troughs* for confirmed cases.
If the wave timings are correct, it means that the very first Wuhan *peak* in Covid cases would have occurred between Christmas 2019 and New Year 2020, with the trough coming on the 29th of February 2020.
By rolling the global cases wave rate back even further though, we can estimate the start of the pandemic:
We estimate that the start of the pandemic was on or around the 1st November 2019, a date calculated by deducting 120 days from the 29th February 2020.
That would be just after the 2019 Military World Games ended in Wuhan
That is, of course, unless there were prior, unrecorded cases….
Update 6th November 2021:
This article in Science Magazine seems to agree with our estimation
“Consequently, the index case in Hubei likely contracted SARS-CoV-2 on or around 4 November 2019 (95% upper HPD: 15 October; 99% upper HPD: 7 October)”
Science Magazine: Timing the SARS-CoV-2 index case in Hubei province
More in our Decoding Sars-Cov-2 series:
-
- How bad will the winter wave of 2021 – 2022 be?
- How are global Covid waves formed, and can we predict future waves?
- The extraordinary coding behind Sars-Cov-2
- Does anything else in nature have a 120 day cycle?
- Is Sars-Cov-2 natural or man-made?
- What does the 120 day Covid cycle mean for you?
- Is Sars-Cov-2 hackable?
- Predicting Sars-Cov-2 waves using repeating code snippets
- Sars-Cov-2 is on a 120 day global wave cycle. It may not be a natural entity
- Evidence of two global Covid waves in 2020, and estimating the pandemic start date (this post)
- Sars-COV-2 – a virus that oscillates between killing 5,000 to 20,000 a day for an entire year?
- How bad will the winter wave of 2021 – 2022 be?
Preprint: Molecular evidence for SARS-CoV-2 in samples collected since late summer 2019 in Lombardy
