
Global: Sars-COV-2 – a virus that oscillates between killing 5,000 to 20,000 a day for an entire year?
How is this graph even possible? For more than one year the global death toll for Sars-Cov-2 has oscillated between ~5,000 deaths a day to ~20,000 deaths a day creating a pattern that is almost ECG like in its uniformity. Answers on a postcard please, because we do not see anything natural about this graph.
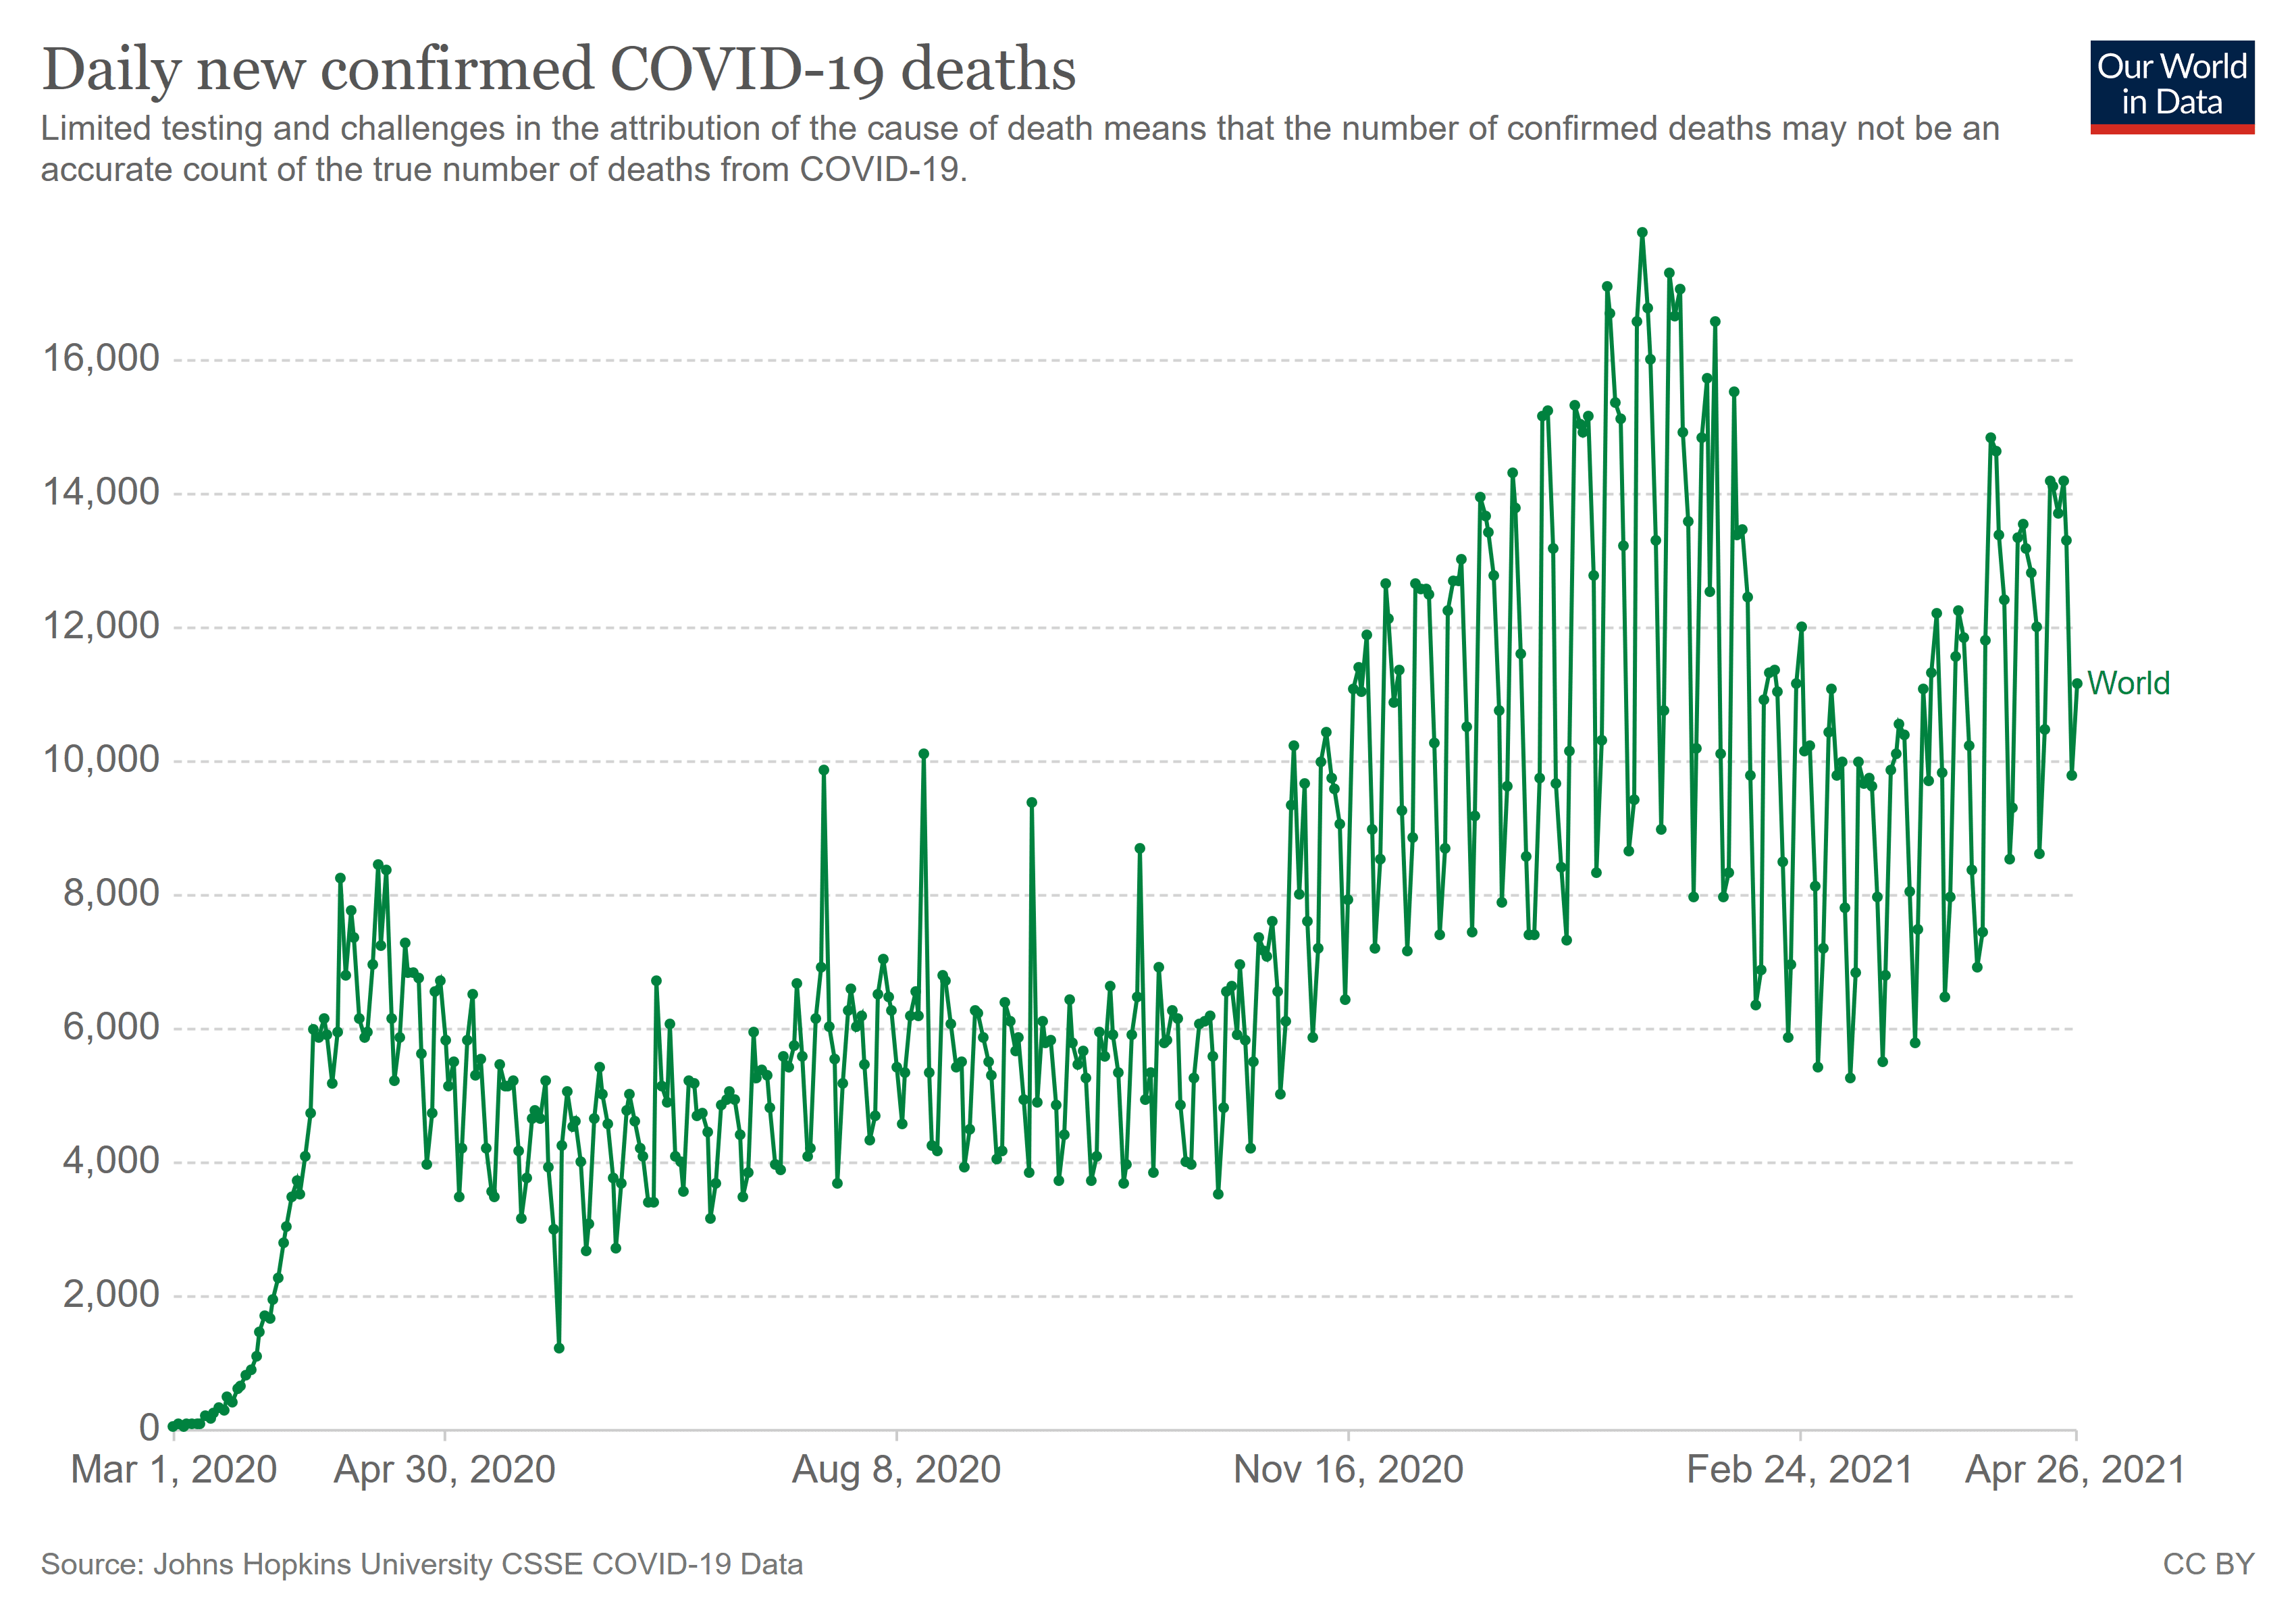
Graph courtesy of OurWorldinData.org
More in our Decoding Sars-Cov-2 series:
-
- How bad will the winter wave of 2021 – 2022 be?
- How are global Covid waves formed, and can we predict future waves?
- The extraordinary coding behind Sars-Cov-2
- Does anything else in nature have a 120 day cycle?
- Is Sars-Cov-2 natural or man-made?
- What does the 120 day Covid cycle mean for you?
- Is Sars-Cov-2 hackable?
- Predicting Sars-Cov-2 waves using repeating code snippets
- Sars-Cov-2 is on a 120 day global wave cycle. It may not be a natural entity
- Evidence of two global Covid waves in 2020, and estimating the pandemic start date
- Sars-COV-2 – a virus that oscillates between killing 5,000 to 20,000 a day for an entire year? (this post)
- How bad will the winter wave of 2021 – 2022 be?
WHO: the first substantial decline in global Covid cases in more than two months
** This post was originally published on April 27, 2021 **
Related Posts:


