Is the global Sars-CoV-2 decline already petering out? *4 UPDATES & 1 PREDICTION*
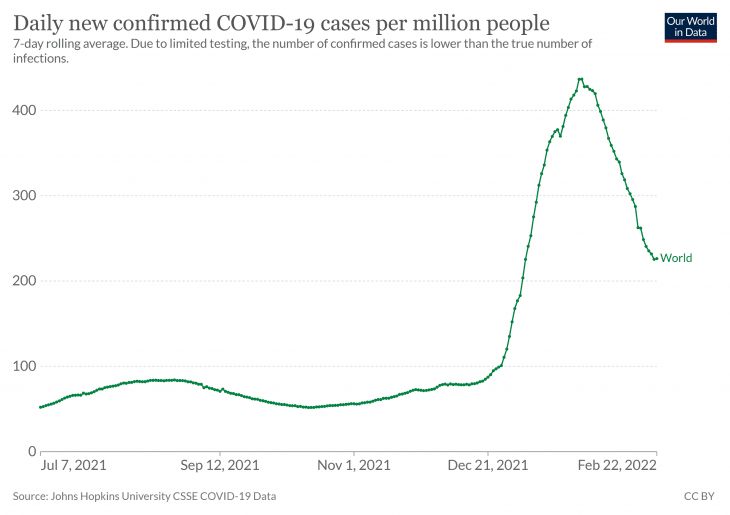
Is the Omicron decline already petering out? There’s not much to go on yet, a few stutters in the world cases chart, some countries starting to see new surges, but it all looks vaguely familiar.
We’ll keep you updated so you don’t have to bother checking. The chart below should update to show the latest global situation.
UPDATE 1 – 3rd March 2022
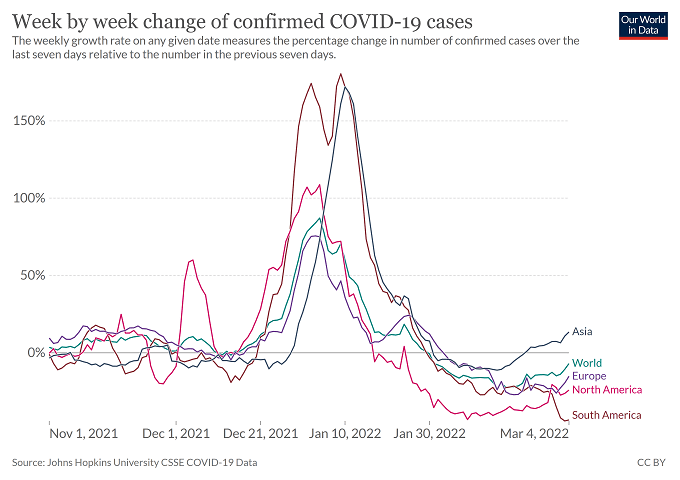
The chart below outlines the week-by-week changes in Sars-CoV-2 cases across the globe, and shows why the current trough may have reached its lowest point. These changes are visible long before they appear as increases in the new cases chart.
If you zoom into the chart and look at the daily changes for early March 2021, and then compare them to the daily changes in early March 2022, you can see that the climb out of the trough is at a faster rate in 2022.
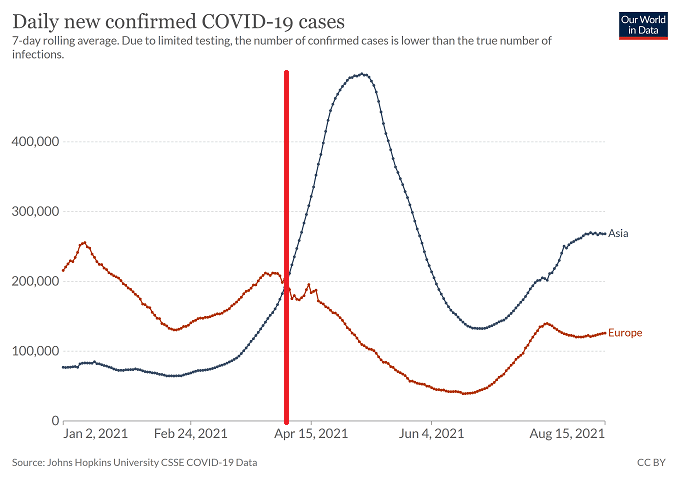
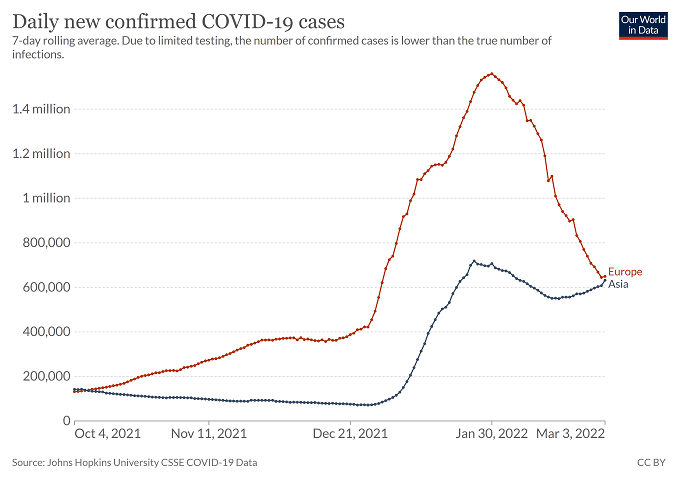
UPDATE 2 – 4th March 2022: Asia/Europe wave crossover point is much earlier than 2021
In 2021, the crossover between the European and Asian waves didn’t occur until April 5th 2021.
In 2022, the crossover of the Asia and European waves is happening a month earlier and at a much higher case level.
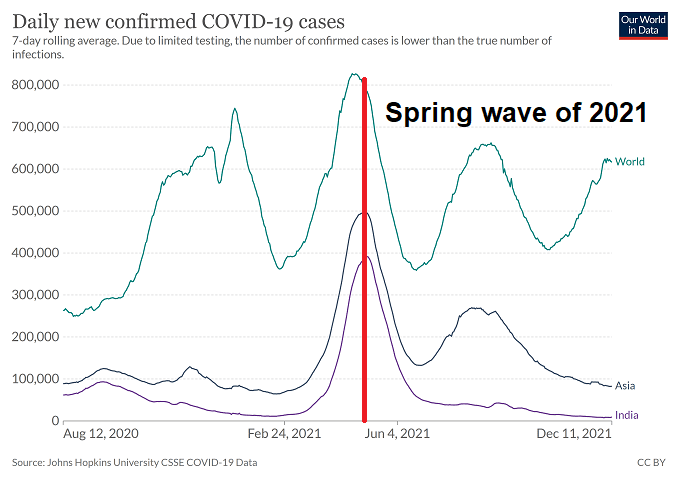
Prediction: There’s likely a VERY LARGE WAVE BREWING IN ASIA.
The spring 2021 wave was largely comprised of cases from Asia, most notably India. Prior to the Omicron winter wave of 2021/2022, the spring wave was the largest global wave so far.
The 2022 spring wave will certainly dwarf the previous year’s spring wave as case rates in Asia are already higher than at the peak of that wave.
UPDATE 3 – 5th March 2022: Europe, North America and Asia are starting to see a lift in their week-by-week case change rate too:
UPDATE 4 – 5TH March 2022
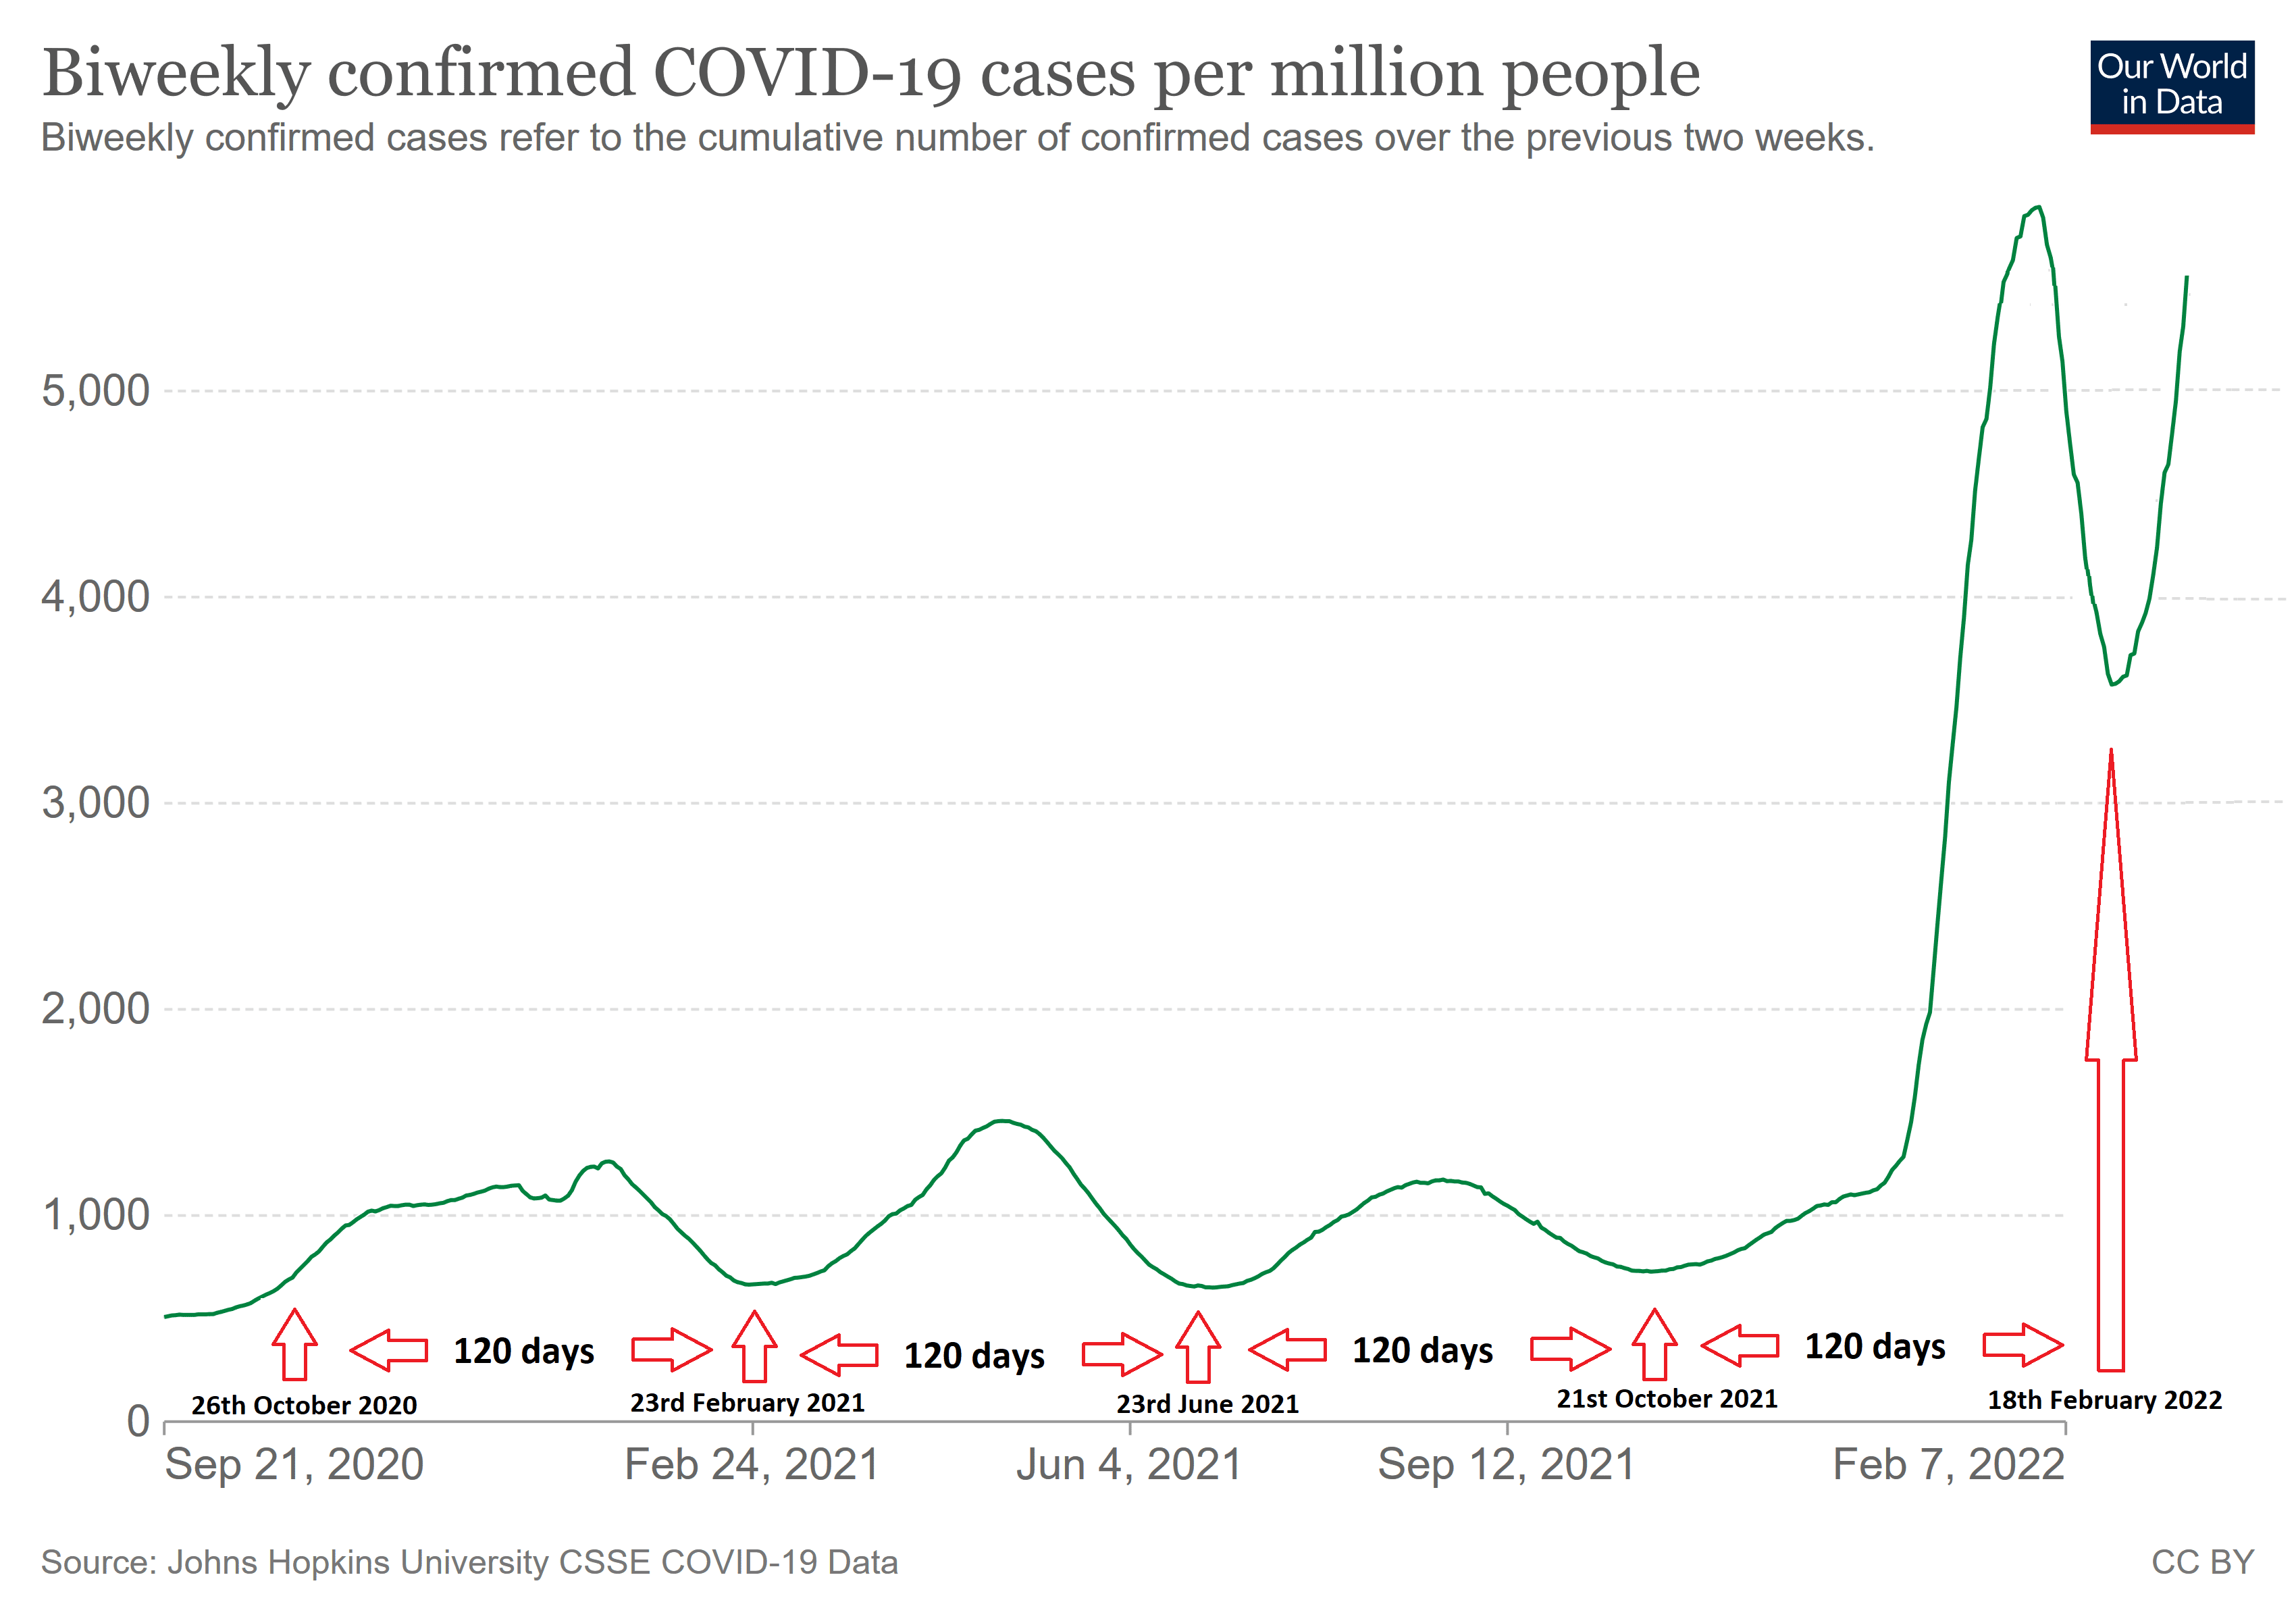
Below is a prediction for global biweekly cases from our post “Has Omicron broken the 120 day SARS-CoV-2 global wave cycle?”
The change in trend that we predicted in that post was nearly two weeks later than we anticipated, and the actual peak of the winter wave was similarly late, but the forecast was near enough for us to continue with the work. We are already looking at whether winter waves are naturally longer than spring and summer waves, which might account for the difference.
The chart for Hong Kong below still ranks as one of the most shocking of the entire pandemic for us. It’s actually from March 2022, but it looks like it’s from March 2020, with the link between cases and deaths immediately obvious.
We will be looking at Hong Kong again shortly. In particular, we will be focusing on whether a new mutation or variant is responsible for the unusual picture we are seeing with infections and deaths in Hong Kong.
